Intercity Access
The primary benefits of transportation investments are often expressed in terms of time, cost, and/or safety for travelers moving between trip origins and destinations. However, there can be wider economic benefits when businesses gain access to broader labor, customer, and/or supplier markets. These effects increase productivity through what economists call agglomeration economies by increasing scale economies of production, matching of specialized worker skills to business needs, or matching of specialized business products or services to customer needs.
TREDIS recognizes three spatial ranges of market access effects.
- Local Market access focuses on urban-scale labor markets and consumer markets, which largely occur within a travel time range.
- Regional Market access focuses on same-day freight deliveries and same-day tourism, which largely occur within ranges of up to four hours each way. It can also generate —mega-region economic integration— benefits by connecting regions that have complementary industries.
- Access Times for Intermodal Connectivity focuses on the ability to access airports, rail terminals, and marine ports, which are gateways to broader national and international markets for people and freight.
Guidance
Not all projects or programs analyzed in TREDIS will have market access benefits. In general, they occur when there is a new or substantially improved network connection between population and business centers, or expanded modal options, or a shift to higher density development. A typical analysis will address at most just one or two of these categories.
-
Local Market — Corridor Investment. A corridor investment will connect a city to outlying areas, increasing the population within commuting range of the city and vice versa (connecting at least 15,000 people in outlying areas).
-
Regional Market — Corridor Investment. A corridor investment will enlarge the same-day travel and delivery market surrounding an employment center (adding at least 20,000 population or a business base of over 10,000 workers to that market).
-
Airport Access Time. A corridor investment will shorten average travel time from the city to a major airport (by at least 15 minutes).
-
Freight Rail Access Time. A corridor investment will shorten average travel time from the city to a TOFC/COFC terminal (by at least 10%).
-
Marine Port Access Time. A corridor investment will shorten average travel time from the city to a major marine port (by at least 10 minutes).
Regional Access Definition
The Regional Access Definition tab is the first step in defining access changes. The first Region defined on the Regions page is the selected region by default, but you can choose any Region. Each Region will have defaults for the selections, including the County of Focus and the intermodal access points.
These selections become relevant when you enter data on the Inputs tab, since the selections on the Regional Access Definition tab determine the baseline that all the data entered in Inputs is in reference to.
The map in the lower left corner shows all the Regions defined for the analysis. The main map shows just the current selections.
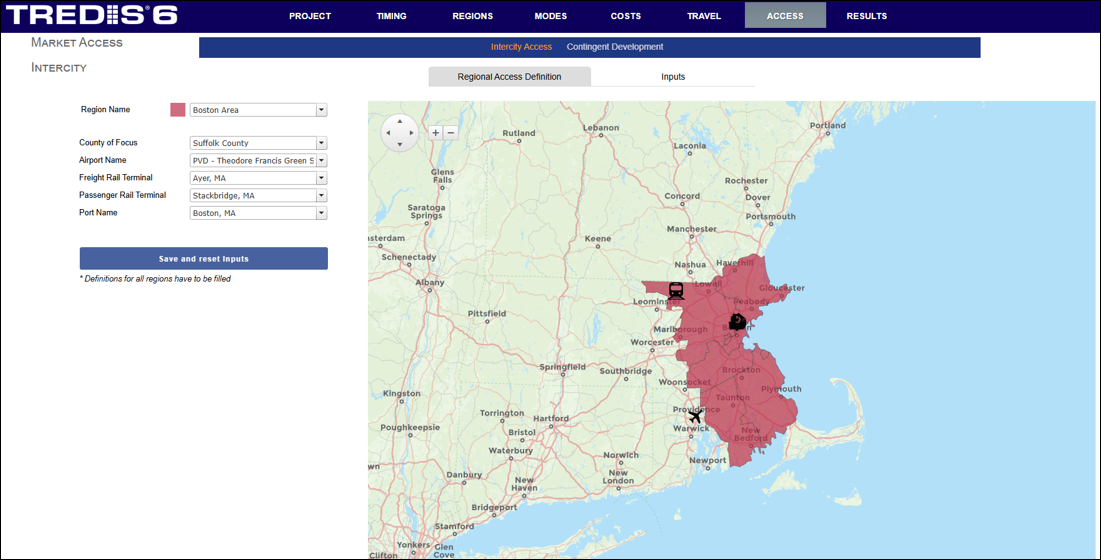
- Region Name. Select one of the regions you defined on the Regions page. All the subsequent selections depend on this selection.
- County of Focus. Select one of the counties within the Region. All the subsequent selections depend on this selection.
Airport Name, Freight Rail Terminal, and Port Name are all dropdowns (where multiple are available) to indicate the average time to reach the facility from closest to the most populous city in the county selected. Defaults are provided.
- Airport Name options are mid- to large airports.
- Freight Rail Terminal options are TOFC/COFC terminals.
- Port Name options are marine ports.
The selected options are shown on the main map.
Once all your selections are made, click the Save and Reset Inputs button to update the Inputs tab with default data for your selections.
Inputs - Business Access
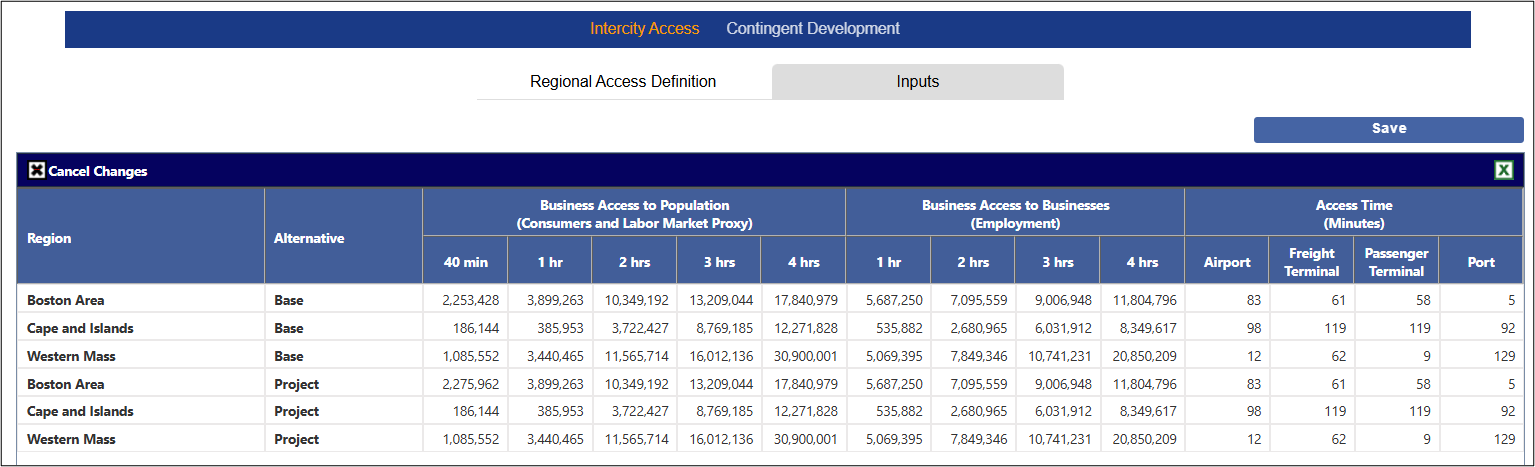
On the Inputs tab, under the Business Access to Population (Consumers and Labor Market Proxy) and Business Access to Businesses (Employment) sections, you can enter values for Base and Project alternatives representing the total accessible population or number of jobs.
TREDIS automatically fills in identical default values for the Base and Project alternatives when the project is created. You may substitute your own inputs if available, keeping in mind that inputs for the Project alternative should match the Base alternative except where changes are to be expected.
Metrics
The columns under the Business Access to Population section represent the number of people that can reach the center of the county by car in the indicated amount of time. The Business Access to Businesses metrics are similar, except they measure the number of jobs. So, in the row for Boston Area, the value under Business Access to Population - 40 min column indicates the population that can reach the center point by car within 40 minutes, and the Business Access to Population - 4 hrs column indicates the number that can reach the center point by car within 4 hours. In the same row for Boston Area, Business Access to Businesses - 3 hrs, for example, indicates the number of jobs that can be reached from the center point by truck within 3 hours.
Significance
For Access to Population metrics, the population is taken to be a proxy for the potential labor market that can be employed by firms or consumer market that can be served by firms. With the goal of capturing consumer markets using typical variables available in models, we do not separately measure the number of workers in the calibration data or model application. An increase in the market size for a given distance metric between the Base and Project alternatives means there is a greater pool of talent available to employers, leading to better employment matching, or more access to consumers.
For Access to Business metrics, the measure of jobs indicates potential business relationships that can be leveraged for firms that provide or rely on other inputs.
Preparation
Access to Population and Access to Business both use access measures that normally require a network analysis, utilizing skim trees to identify all Traffic Analysis Zones (TAZs) reachable within various time thresholds from the central point. There are multiple time bands to enable impact decay functions, whereby local market access effects decay over a 40-minute to 1-hour range, while regional market access effects decay over a 1-4 hour range. See documentation for published research supporting these decay patterns.
Inputs - Access Time
Ports, terminals, and intermodal facilities are gateways to broader national and international markets for people and freight, and reducing time to access them can improve connectivity and thus productivity.
On the Inputs tab, under the Access Time section, enter values for Base and Project alternatives representing the time to access the facility defined in the regional access definition.
When your project is created, TREDIS automatically fills in identical default values for the Base and Project alternatives based on your regional access definition. You may substitute your own inputs if available, keeping in mind that inputs for the Project alternative should match the Base alternative except where changes are to be expected.
The metrics are all assumed to be in minutes, representing the average time to the terminal or intermodal facility via truck or car from the central point. A decrease in access time shows how The Access Time columns for airports, rail terminals and marine ports are normally calculated by a highway network model to calculate the shortest time path from each zone's designated city/town center.