Adjust Mode Factors
This screen allows you to change the default values within the current project for those modes which have been selected. Once you have finished entering your changes, please click the Save button at the bottom of the screen. Use the Close button to exit the screen.
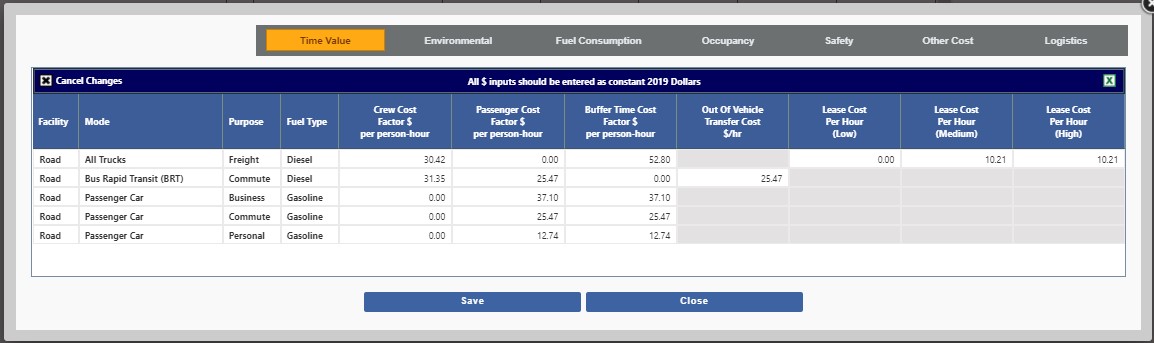
Time Value
-
Crew Cost Factor. Value of time in $/hour of crew.
-
Passenger Cost Factor. Value of time in $/hour of passengers, for each passenger.
-
Lease Cost Per Hour (Low, Medium, High). $/hour in lease costs for vehicles for Low, Medium or High Sensitivity goods freight.
-
Buffer Time Cost Factor. Value of time cost in $/hour of buffer time.
-
Out of Vehicle Transfer Cost Factor. Value of time cost in $/hour of out-of-vehicle transfers.
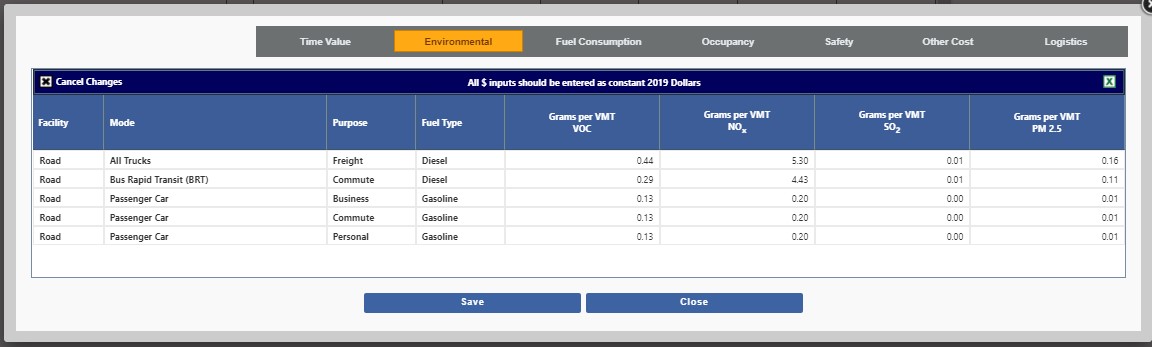
Environmental
-
Grams per VMT (VOC, NOx, SO2, PM 2.5). Grams per vehicle mile traveled.
-
VOC, NOx, SO2, PM2.5 Congestion Penalty Ratio. Ratio of pollutant produced under congested conditions over weight of pollutant produced under free-flow conditions.
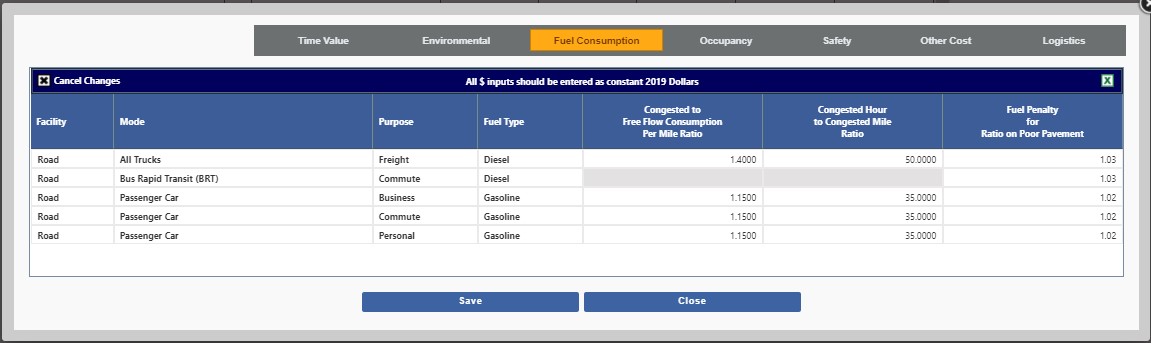
Fuel Consumption
-
Congested to Free Flow Consumption per Mile Ratio. The ratio of fuel per mile consumed in congested conditions to the fuel per mile consumed in free-flow conditions. For example, a value of 2 will cause any driving in congested conditions to expend twice as much fuel.
-
Congested Hour to Congested Mile Ratio. The ratio of fuel per hour consumed in congested conditions to the fuel per mile consumed. This is the equivalent of the average miles per hour in congested conditions for this mode.
-
Fuel Penalty for Ratio on Poor Pavement. The ratio of the penalty value to the ordinary value. For example, a value of 2 will cause any driving on poor pavement to expend twice as much fuel. A value of 1 will mean that driving on poor pavement is identical to driving on normal pavement. Fraction of Pavement in Poor Condition can be adjusted on the Travel page under the Other tab.
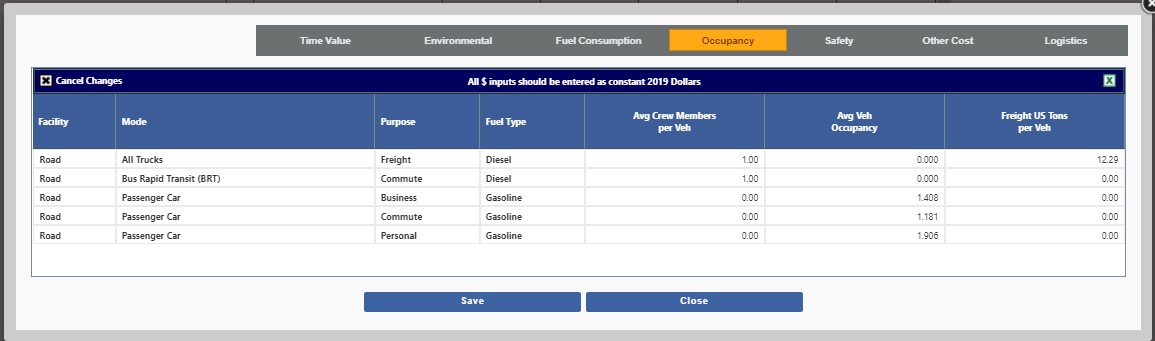
Occupancy
-
Avg Crew Members per Veh. Number of crew per vehicle for transit or freight vehicles, or drivers of taxis or TNCs. Drivers of passenger cars are not included in this figure.
-
Avg Veh Occupancy. Number of non-driver, non-crew passengers per vehicle. Drivers of passenger cars are included in this figure.
-
Freight US Tons per Veh. Average number of freight US tons per vehicle.
Safety
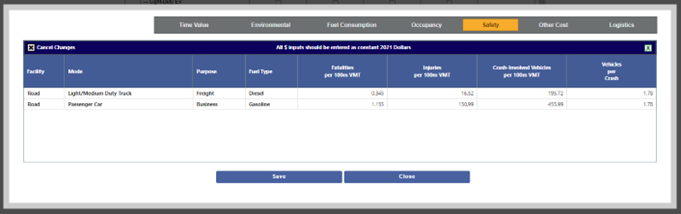
-
Fatalities Per 100m VMT. Number of expected fatalities per 100 million vehicle miles traveled.
-
Injuries Per 100m VMT. Number of expected injuries per 100 million miles traveled.
-
Crash-Involved Vehicles Per 100m VMT. Number of expected crash-involved vehicles per 100 million miles traveled.
-
Vehicles per Crash. Number of expected vehicles involved in each crash.
Other Costs
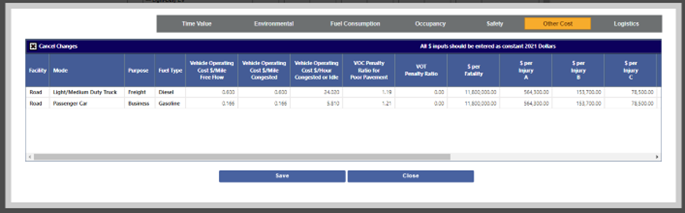
-
Vehicle Operating Cost ($/Mile Free Flow, $/Mile Congested, $/Hour Congested or Idle). Cost of operating each vehicle per mile or hour, depending on conditions.
-
VOC Penalty Ratio for Poor Pavement. Ratio of the penalty value to the ordinary value. For example, a value of 2 will cause any driving on poor pavement to cost twice as much in vehicle operating costs as on normal pavement. A value of 1 will mean that driving on poor pavement is identical to driving on normal pavement. Fraction of Pavement in Poor Condition can be adjusted on the Travel page under the Other tab.
-
VOT Penalty Ratio. Ratio of the penalty value to the ordinary value. For example, a value of 2 will cause any travel time identified or adjustment (entered in Travel Characteristics) to cost twice as much in Value of Time. A value of 1 will mean that driving on poor pavement is identical to driving on normal pavement. Fraction of Pavement in Poor Condition can be adjusted on the Travel page under the Other tab.
-
$ Per Fatality. The social benefit of each averted fatality.
-
$ Per Injury (A, B, C, O, U). The social benefit of each averted injury of the severity indicated on the KABCO scale. U means the severity is unknown.
-
$ Per Crash-Involved Vehicle. The social benefit of each averted crash-involved vehicle.
-
Other Societal Benefits. A positive number representing other non-monetary benefits not otherwise represented, such as public health benefits of cycling. These are done on a vehicle-mile basis.
-
Other Societal Costs. A positive number representing other non-monetary costs not otherwise represented, such as noise. These are done on a vehicle-mile basis.
-
Company Share. Fractional share of TNC fare that to the company.
Logistics
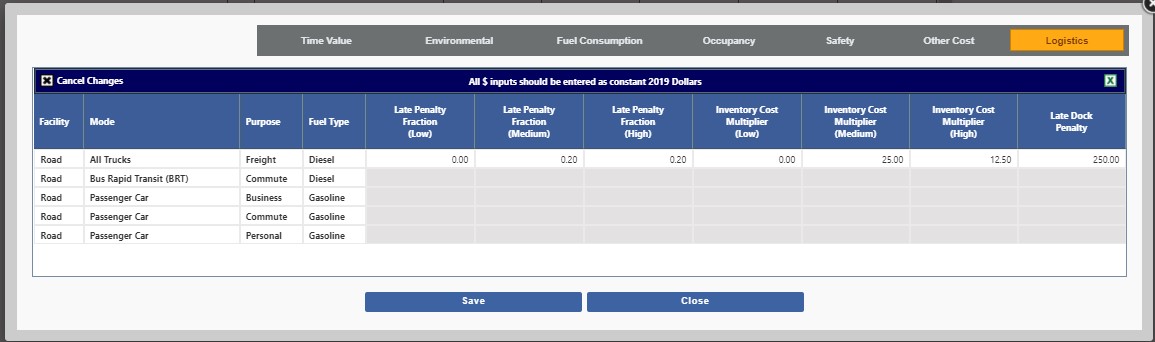
-
Late Penalty Fraction (Low, Medium, High). Probability (0 to 1) that a late dock penalty will be assessed for Low, Medium, or High sensitivity goods for every hour of buffer time suggested by the buffer time index calculation.
-
Inventory Cost Multiplier (Low, Medium, High). Multiple applied to the cost of goods for Low, Medium, or High sensitivity goods in order to estimate the other logistics and supply chain costs of unreliability beyond equipment costs, inventory carrying costs, and dock penalties. These other logistics costs are calibrated to follow NCHRP 824 and 925 but include variation by commodity.
-
Late Dock Penalty. Average penalty assessed when a shipment arrives late at its destination to cover dock workers’ time and other supply chain costs that are incurred at the facility and passed on to the shipper or receiver.