Equity Reports
The Equity reports section provides insight regarding the extent of economic hardship (poverty, low income, high unemployment, lack of car ownership) and historically underserved populations (elderly, physical disability, racial/ethnic minority status) among the study regions. This is expressed in terms of both baseline context and project impact.
Equity Context
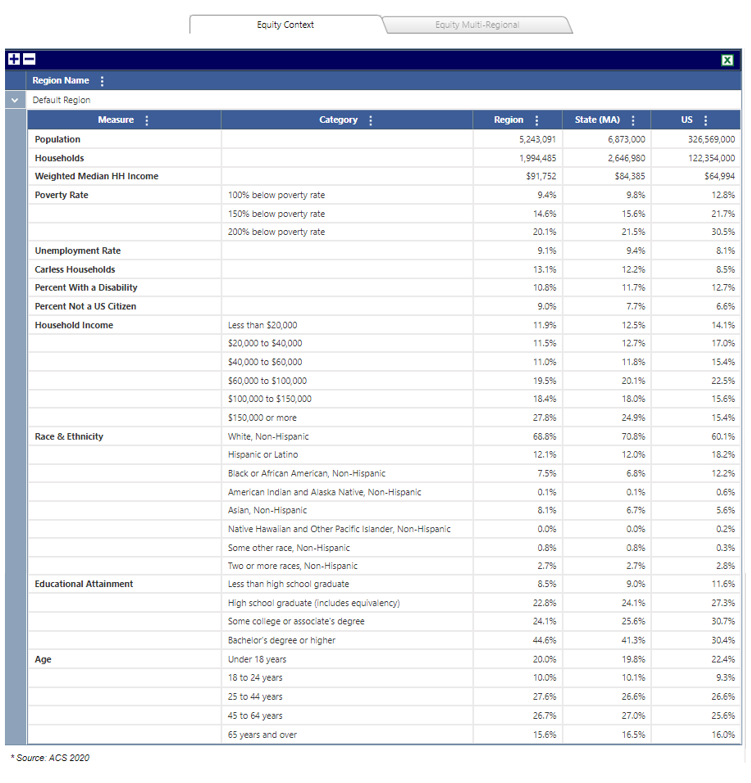
The Equity Context report shows current baseline conditions for each study region. This includes rates of economic hardship among each region’s population (poverty, low income, high unemployment, lack of car ownership) and the percentage shares of historically underserved populations (elderly, physical disability, racial/ethnic minority, non-citizen) living in each region. These measures are compared to state and national figures, so you can see how each region compares to wider area averages. This provides baseline insight for interpreting the impact findings presented in the next tab.
Benefit/Impact Distribution
In addition to simply comparing a project's regions directly in terms of their populations, the Benefit/Impact Distribution reports show how the benefits and impacts of a project are distributed to the regions, along with some equity measures of interest. In this way, you may quickly see whether the regions that enjoy benefits or impacts are the same regions that may have the greatest need.
Transportation Benefits
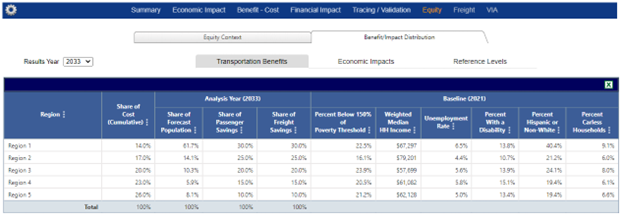
In this report, the distribution of regional benefits reported under Benefit – Cost reports are presented alongside equity measures.
The Results Year dropdown can be used to see specific operations years.
-
Share of Cost (Cumulative). Percentage of all costs as entered in the Costs page, summed across all Construction Years
-
Share of Forecast Population. Percentage of the forecasted population (in the Base alternative) for the Analysis Year
-
Share of Passenger Savings. Percentage of total savings experienced by modes with a purpose of Business, Personal, or Commute
-
Share of Freight Savings. Percentage of total savings experienced by modes with Freight purpose
The columns under the Baseline rubric reiterate the equity measures for each region for convenient comparison with shares of savings.
Economic Impacts
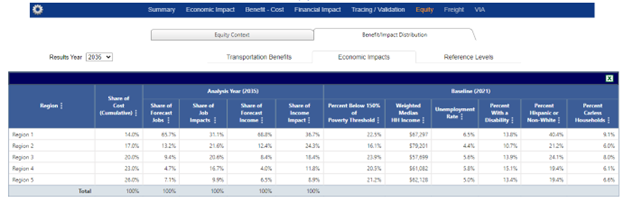
In this report, the distribution of regional economic impacts reported under Economic Impacts reports are presented alongside equity measures.
The Results Year dropdown can be used to see specific operations years.
-
Share of Cost (Cumulative). Percentage of all costs as entered in the Costs page, summed across all Construction Years
-
Share of Forecast Jobs. Percentage of the jobs (in the Base alternative) for the Analysis Year
-
Share of Job Impacts. Percentage of the change in total jobs that are an impact of the Project alternative in the Analysis Year
-
Share of Forecast Income. Percentage of the labor income (in the Base alternative) for the Analysis Year
-
Share of Income Impact. Percentage of the change in total labor income that is an impact of the Project alternative in the Analysis Year
The columns under the Baseline rubric reiterate the equity measures for each region for convenient comparison with shares of savings.
Reference Levels
This report gives context to the Transportation Benefits and Economic Impact reports by showing the distribution for each of the equity variables of interest among the geographic units analyzed.
The Measures shown for the Modeled Regions take each Region defined in the model as an observation. The State and National geographies take each county in the state or the US as the unit of observation.
For each equity measure, three measures are shown:
-
Top 20th. The cutoff point above which 20% of regions or counties have higher levels of the observed statistic
-
Median. The median observation for the statistic
-
Bottom 20th. The cutoff point below which 20% of regions or counties have lower levels of the observed statistic
In any of the other Equity reports, you can see that Region 1 has an unemployment rate of 6.5%. From the points shown in the Reference Levels for top 20th, median, and bottom 20th – 5.8%, 5.6%, and 5.0%, respectively – you can see that 6.5% is relatively high among the regions modeled for this project.
However, within the State, Region 1 ranks somewhat better, since among all the states’ counties, 7.5% is the cutoff for the top 20th. Region 1’s 6.5% unemployment rate is below that and thus better than at least 20% of the counties in the state (assuming Region 1 doesn’t include any of those counties).
Nationally, however, Region 1 would still be higher than 80% of counties, which we can say because the top 20th percentile is only 5.9% for all counties in the US for the data from year 2021 in this example.