2023-11 Equity Reports
Equity Distribution Reports
The Equity section of the Results page already features the Equity Context report, which shows the extent of economic hardship (poverty, low income, high unemployment, lack of car ownership) and historically underserved populations (elderly, physically disabled, those with racial/ethnic minority status) among the regions defined for a project.
With this release, additional Benefit/Impact Distribution reports have been added to the Equity suite. These are designed to help you understand the distribution of benefits and economic impacts on each region in a project. Using the reports, you may determine if a project disproportionally affects a disadvantaged region (either positively or negatively).
This new functionality is provided through three new subreports, all accessible via the Equity tab (on the Results page), under the Benefit/Impact Distribution sub-tab.
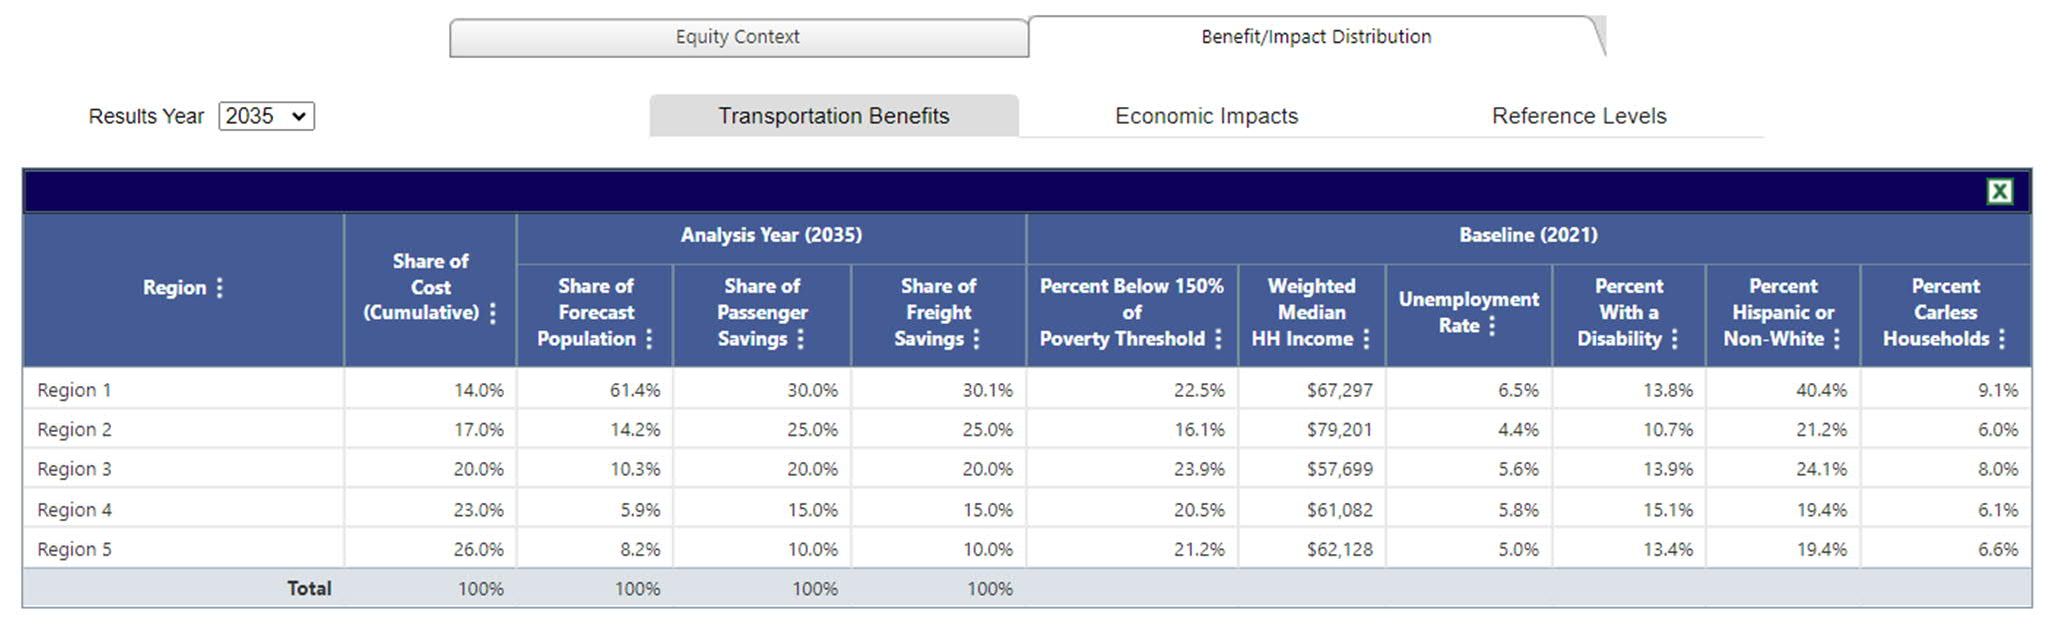
The Transportation Benefits report shows the respective share of total benefits in each region, along with key regional indicators (as reported in the Equity Context report). It is intended to show whether the regions that enjoy benefits or impacts are the same regions that may have the greatest need.
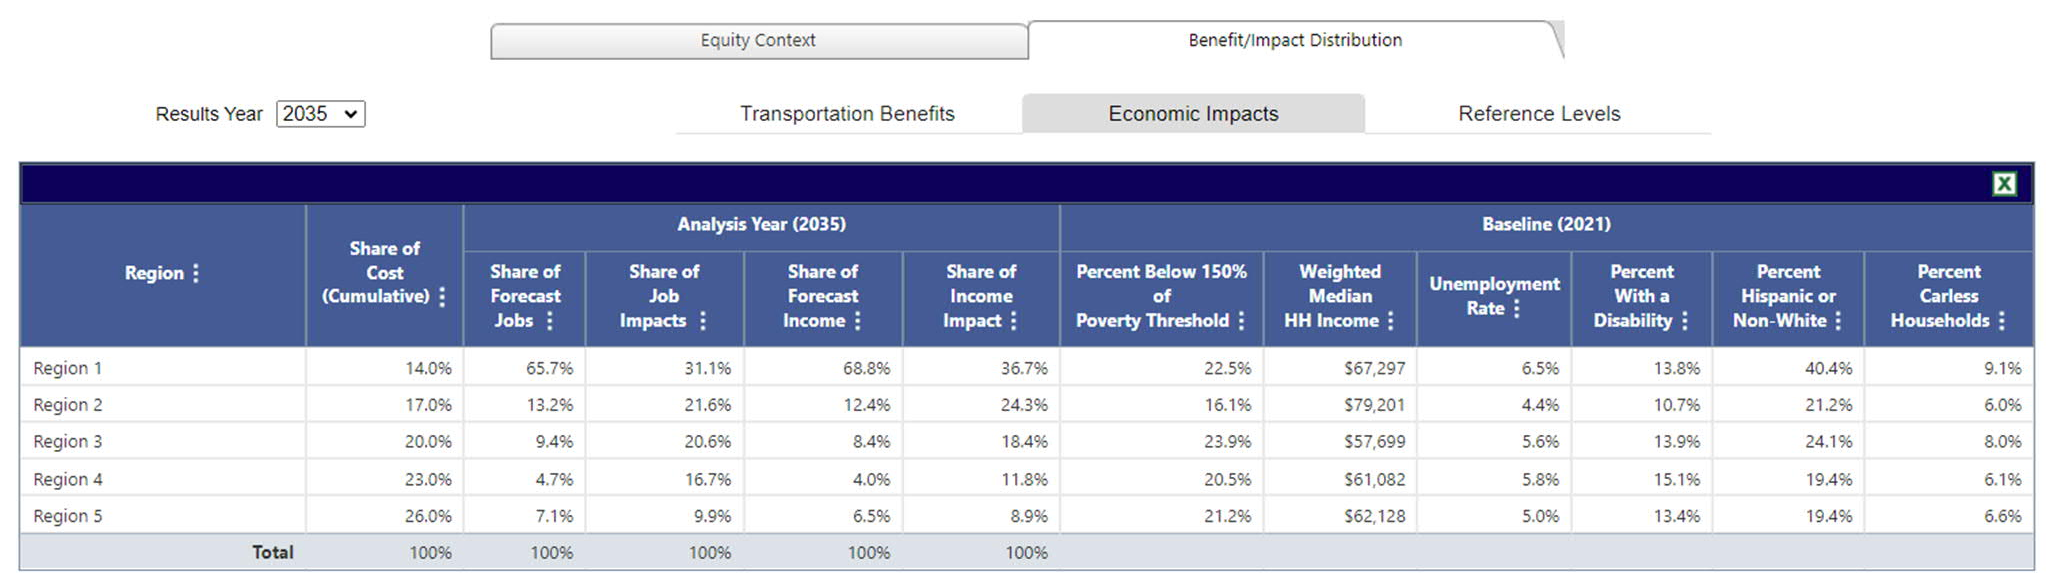
The Economic Impacts report presents the shares of total economic impacts that each modeled region is estimated to experience; the Baseline section again provides a convenient reference for indicators of interest for the regions.
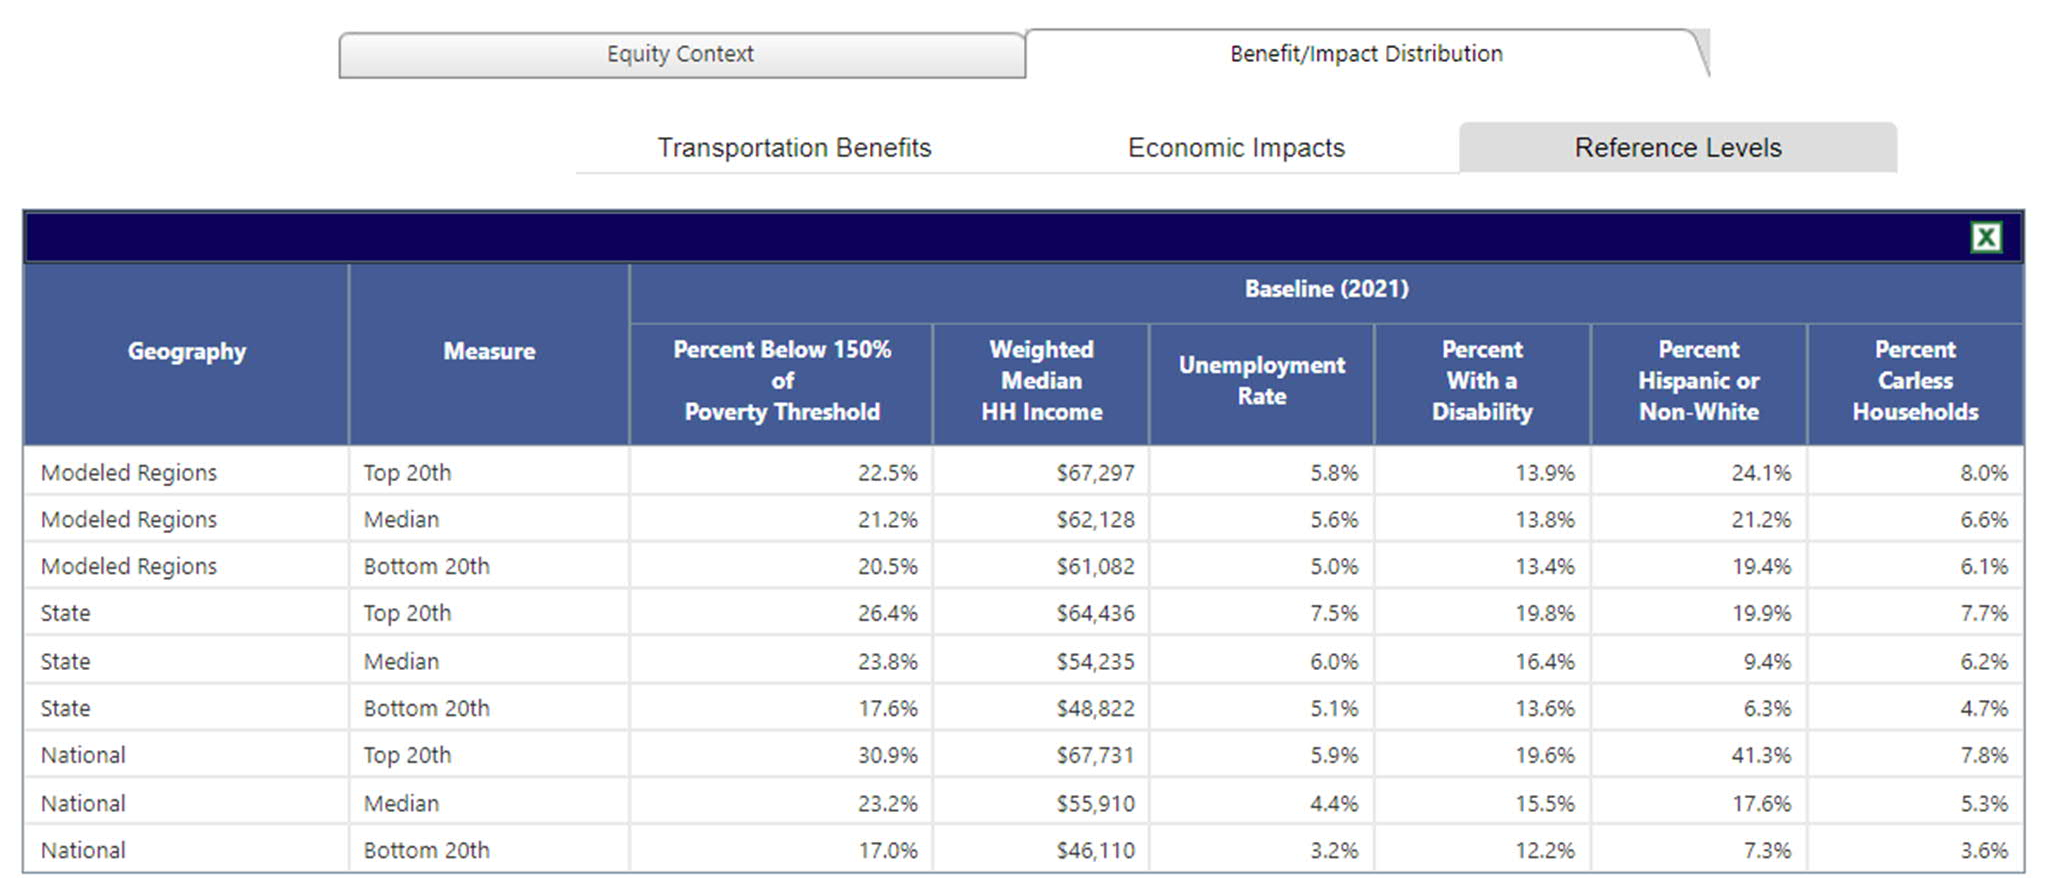
The Reference Levels report gives context to the above by showing major ranking threshold for indicators, based on the relative ranking. State and National thresholds are displayed as well.
Consult the TREDIS User Manual for a complete discussion of the interpretation of the reports.